![]()
Founded by Max Farndale 1947 - 2018
![]()
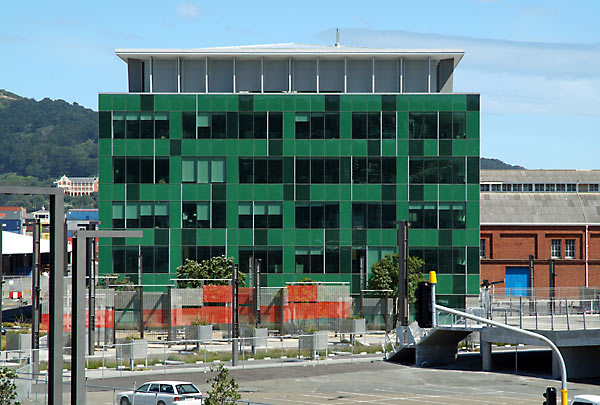
Engineers say results from the Statistics House investigation will help build more resilient buildings.
New Zealand Society for Earthquake Engineering (NZSEE) President Peter Smith says every earthquake provides new information on how to improve building design.
“Investigations like this are crucial to making our buildings safer. We need to gain access to detailed information on how other buildings performed, to help widen understanding of whole-of-building performance.
“Statistics House illustrated how different factors can combine in unexpected and unprecedented ways.
“In Wellington, this earthquake most severely affected mid-height buildings. Because the earthquake was so far away, only low-frequency waves made it to the Capital. These waves resonated with mid-height buildings, which combined with the earthquake’s long duration meant mid-height buildings experienced severe shaking.
“Basically these flexible, modern buildings experienced a design-level earthquake – an earthquake that met or exceeded what they were designed to withstand.
“At the same time, shorter and stiffer buildings experienced an earthquake that wasn’t even one-third of Code. But these earthquake-prone buildings still pose a significant risk to public safety, especially in an earthquake centred closer to Wellington. It’s really important that vulnerable features on these buildings, such as parapets and facades, are secured during this time of heightened seismic risk.”
Structural Engineering Society (SESOC) spokesperson Paul Campbell says the Statistics House investigation has revealed that buildings with key characteristics may be vulnerable in an earthquake that’s both large and long.
“In a large and long-duration earthquake, these key characteristics are flexible frames in combination with precast floors.
“Flexible frames are designed to bend so that the ends of the beams experience controlled damage.
“But the Kaikoura earthquake has confirmed that if an earthquake is strong enough and long enough, the damage can make the beams grow in length. This means the supports for the pre-cast floor system can move too far apart, potentially causing parts of the floor to lose their support and collapse.
“When Statistics House was built, the Building Code did not allow for this combination of factors – but it does now.
“The Canterbury earthquakes led to Building Code changes – and now more changes are likely given what we have learned from the Kaikoura earthquake.
“Engineers will be working with MBIE to further develop detailed guidance on assessing and retrofitting buildings with these characteristics.”
| An IPENZ release | March 31, 2017 |||
SESOC and NZSEE are IPENZ technical groups.
Rising property values helped lift New Zealand’s net worth to just over $1.39 trillion at 31 March 2015, up 9 percent on 2014, Stats NZ said today.
“Net worth reflects the balance of what New Zealanders own and what they owe – that is, assets minus debts held by households and government,” national accounts senior manager Gary Dunnet said.
Except for a 3 percent decline in 2009, net worth has grown steadily since 2007 – from just over $1 trillion in 2007 to $1.39 trillion in 2015.
Graph, New Zealand's net worth,at 31 March, 2007–15
From 2007 to 2015, household net worth increased $319 billion (35 percent), to about $1,236 billion. Investment in land and buildings (non-financial assets) was a significant contributor to this increase, although this was partly offset by increased mortgage debt (loans liabilities).
Over the eight years, households also built up wealth through increased bank deposits (up 58 percent), investment in business shares (up 28 percent), and insurance and superannuation funds (up 90 percent).
The value of all assets owned by New Zealanders was nearly $4.0 trillion ($3,953 billion) in 2015. This figure consisted of financial assets (cash and deposits, loans, and investments) and non-financial assets (land and buildings; plant, machinery and equipment; and business inventories) valued at $2,404 billion and $1,549 billion, respectively.
All financial liabilities totalled $2,557 billion in 2015, with the largest contributions coming from equity (37 percent), and loans (30 percent).
Over the 2007–15 period, the net amount New Zealanders owed to the rest of the world rose from $130 billion to $153 billion.
“This first release of balance sheet statistics marks a significant milestone in our ongoing work to achieve a full set of national accounts,” Mr Dunnet said.
“Balance sheets help to relate economic growth to the accumulation of wealth, and to understand how financial shocks affect the productive economy. By filling these gaps, government, businesses, and households will have more economic information to make better decisions.”
Balance sheets are used to provide estimates of assets, liabilities, and net worth held by New Zealand businesses, households, and government.
Annual balance sheets are now part of Stats NZ’s suite of annual macroeconomic statistics. In coming years, we’ll add related financial information, including quarterly balance sheets and flow-of-funds estimates.Information in this release is based on data from a range of sources, some of which is only available up to 2015.

French Polynesia begins in New Zealand
He looks like the star of a television series set in the 1950s about British country doctors or family solicitors of those solid and dependable times. But former French premier Francois Fillon considered by the English-speaking world to be a shoo-in for his country’s presidency is now looking anything but a winner.
In recent weeks the Mr Clean of europolitics has found himself be-spattered in every variety of calumny and remarkable even for a country renowned for its political spoils system.
The hapless Mr Fillon is looking less and less like the fulcrum around which will rally the centrist forces in the event of a first round win by the National Front’s Marine Le Pen.
At the cusp of the 1960s/1970s France was the focus of New Zealand’s global trade interest for the way in which it was perceived to be throwing a spanner into the primary produce works as Britain made its transition into the Common Market, as the EU was then described.
Yet in a bizarre about turn France has now become as important to New Zealand industrially as Britain was in those days.
This is artfully concealed from public view though by a politico-media determination to keep the trade spotlight on Asia and the Middle East
Here though are just some of the French companies that dominate their sectors in New Zealand:- ‘
* Veolia Water and commuter transport in Wellington and Auckland. Controls Transdev * Axa Finance – (controls AMP) * Pernod Ricard Owns Montana * Lafarge Holcim Cement * Schneider Electrical manufacturer, formerly PDL * Accor Hotelier * Air Liquide Industrial n gases * Allflex Livestock management applications * Danone Dairy * Parmalat Dairy * Synlait Dairy * Alcatel Information technology * Thomson Air traffic control * Alstom Transport * Rexel Office supplies
This unacknowledged state of affairs took on a humorous form when one of the New Zealand government start-up technology incentive funds invested in what appeared to be a local computer games producer only to find out that it was in fact controlled by Vincent Bollore.
He is known as the Breton Raider, and who from his gigantic holdings in transport and commodities in Africa has devolved into the leisure-entertainment sector.
The officially encouraged focus on the East contains a romantic Prester John–like flavour in refusing to acknowledge how hard it is for anyone but the very biggest traders to actually get paid from anyone in these regions.
It also shrouds the mercantile dependence on a country such as France. This is demonstrated by a French trade deficit of $845 million in 2014. In France’s favour.
Back now to Mr Fillon who until a few weeks ago was considered the favourite for the Elysees and thus the man to usher in New Zealand’s EU trade agreement.
His role even as the rallying point as the second round coalition leader in the French presidential double is now being questioned.
The favourites now are the National Front’s Marine Le Pen head-to-head with the former Socialist Party economics minister Emmanuel Macron and his own personal party France on the Move.
For Mr Fillon trouble does not travel alone. Not only is he being charged with putting his family on his parliamentary payroll, and for influence peddling, which is all pretty much part of French political life anyway.
In the unkindest cut of all he is also being accused of receiving his fine-cut English style suits as gifts from wealthy benefactors.
| From The This email address is being protected from spambots. You need JavaScript enabled to view it. \ Friday 31 March 2017 \\\
Energy and Resources Minister Judith Collins is leading a petroleum sector trade delegation to Texas and an electricity sector trade delegation to Silicon Valley next week.
Ms Collins will be accompanied by a petroleum sector delegation, which includes representatives from New Zealand Oil and Gas, Todd Energy and the Petroleum Exploration & Production Association of New Zealand, to Texas.
In Texas, Ms Collins will be attending the American Association of Petroleum Geologists’ Annual Convention & Exhibition in Houston, as well as meeting with exploration and service companies to discuss investment opportunities in New Zealand.
Ms Collins will then lead an electricity sector delegation, which includes representatives from Mercury, Contact Energy, Vector, Power Systems Consultants and Genesis Energy, to California’s Silicon Valley.
“The electricity sector is going through a lot of change internationally and the trade mission to Silicon Valley will help New Zealand companies learn about the opportunities with emerging technologies, support New Zealand businesses looking to partner with US firms, and encourage electric vehicle manufacturers to enter the New Zealand market.”
The delegation to Silicon Valley is due to make calls on Tesla’s electric vehicle plant, Siemens, Volkswagen, energy technology company Enphase, Plugshare, SolarCity, Pacific Gas & Electric, Wrightspeed and Californian State energy regulators.
Ms Collins will be in the United States from 1 to 7 April.
| A Beehive release | March 31, 2017 |||
Twelve of the 15 regional economies in New Zealand recorded nominal GDP increases in the year ended March 2016, Stats NZ said today.
Provisional estimates show the largest percentage increases were in the Bay of Plenty (7.7 percent), Auckland (6.0 percent), and Otago (4.8 percent). The national increase was 4.1 percent.
“The Bay of Plenty’s increase was underpinned by strong performances across the professional and administrative services, and agriculture, primarily kiwifruit,” senior national accounts manager Gary Dunnet said.
“The increase in Auckland was driven by the professional services, finance, and transport industries.”
Decreases were recorded in Taranaki (8.5 percent), the West Coast (2.8 percent), and Southland (1.0 percent).
“These decreases reflected a fall in mining and agriculture activity, mainly from the impact of lower international prices for oil, coal, and dairy products,” Mr Dunnet said.
Despite a fall in the region’s GDP, Taranaki retained the highest GDP per capita ($71,297), followed by Wellington ($67,888) and Auckland ($58,717). The Northland region had the lowest GDP per capita ($36,531). The national average was $54,178.
New Zealand's regional economies 2016 visually presents the key measures of the 15 regional economies.
This year's regional GDP release includes an additional year of provisional data for 2015 about regional industry activity.
Regional Gross Domestic Product: Year ended March 2016 – for more data and analysis
| A STATSNZ release | March 30, 2017 |||
Ξ Statistics House investigation findings released
Ξ New Zealand's net wealth tops $1.3 trillion
Ξ Latest NZTE Export News
Ξ Regional Gross Domestic Product: Year ended March 2016
Ξ Windows 10's next major update arrives April 11

Ξ Malaysian civil defence force place order with Sealegs
Ξ Explanation of America’s Cup rules and process for rule changes
Ξ Windows 10's next major update arrives April 11Windows 10's next major update arrives April 11
Ξ Trans-Tasman telco cable completed
Ξ Russia willing to re-start NZ free-trade talks frozen over Crimea conflict
Ξ The Reserve Bank Bulletin article reviews business cycle
Ξ Last chance to register for - Export Documentation for Food and Beverage seminar

In a bid to get around terrestrial height restrictions, Clouds Architecture Office has proposed suspending the world's tallest skyscraper from an asteroid, leaving residents to parachute to earth.
New York-based Clouds Architecture Office drew up plans for Analemma Tower to "overturn the established skyscraper typology" by building not up from the ground but down from the sky by affixing the foundations to an orbiting asteroid.
"Harnessing the power of planetary design thinking, it taps into the desire for extreme height, seclusion and constant mobility," said the architects, who have previously drawn up proposals for space transportation and a 3D-printed ice house on Mars.
"If the recent boom in residential towers proves that sales price per square foot rises with floor elevation, then Analemma Tower will command record prices, justifying its high cost of construction."
Continue here on de zeen to read the full article with images | March 30, 2017 |||
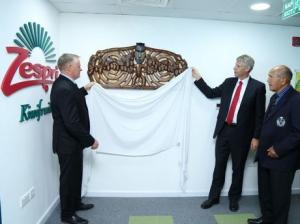
Zespri officially opened its Middle East office in Dubai earlier this week to manage its growing sales and marketing programmes in this region and other developing markets.
Zespri Chief Executive Lain Jager said at the event that Zespri was growing its presence across the Middle East, India and Africa and the new office would support this growth.
“More consumers in the UAE and these regions are enjoying the great taste of premium quality, healthy Zespri Kiwifruit, with sales set to increase by more than 50 percent over the next five years to over 4 million trays of New Zealand fruit and over 2 million trays of global supply (Northern Hemisphere) fruit.
“Zespri’s gold variety SunGold has proved particularly popular with consumers in the Middle East who enjoy its sweet, juicy taste and powerful health properties. Our team in-market is working hard to expand distribution across the region to introduce more consumers to our premium quality fruit and get more of them to buy Zespri Kiwifruit each week,” says Mr Jager.
Zespri’s aim is to grow overall kiwifruit consumption around the world and increase kiwifruit’s share of the global fruitbowl from a fraction of a percent, and building new markets like the Middle East, India and the United States is a key part of this.
A Maori cultural delegation led by kaumatua Kihi Ngatai officially opened and blessed the new office, installing a traditional Maori whakairo (carving) in the office. The carving is named Te Hau Marama which translates to the Wind of Understanding and embraces traditional architecture of the region which takes advantage of desert winds to keep a comfortable breeze for its inhabitants. The carving is made of kauri, traditionally used for pare (lintels) over doorways in wharenui (tribal meeting houses) in New Zealand which provided a boundary between the physical world outside and the spiritual world inside the wharenui.
It is made by James Tapiata who has made several other carvings for Zespri offices in New Zealand and around the world.
| A Zespri release | March 29, 2017 |||
More subdued growth, due to persistent spare capacity in the global economy following the global financial crisis, has been a key feature of the current New Zealand business cycle.
This is a key take-out from a review of the current business cycle, published today in the Reserve Bank Bulletin. Listen to the Behind The Bank Bulletin
The article summarises developments in the New Zealand economy since 2008 through the lens of monetary policy.
The article identifies five key phases: the global financial crisis of 2008-09; ‘green shoots’ recovery (mid-2009 to mid-2010); domestic caution and global uncertainty (mid-2010 to late 2012); commodity boom and construction upswing (early 2013 to mid-2014); and persistently low inflation (mid-2014 to present day).
Despite extremely accommodative monetary policy settings, growth in major advanced economies has proved to be slower than in past expansions. Growth in New Zealand has also been more subdued than in past business cycles, in large part due to weakness and uncertainty abroad. Against this international and domestic backdrop, consumer price inflation in New Zealand has been low.
A follow-up Bulletin article — due to be released in the coming weeks — will present some of the key features of the business cycle and the insights for monetary policy that have emerged or been reinforced.
| A RBNZ release | March 29, 2017 |||

|
|